In Part 1 and Part 2 we calculated the probabilities of passing 3 consecutive lots for an attribute quality characteristic when the sample size and acceptance criterion were applied to each LOT.
We also concluded that, even though going from a=0 to a<=1 resulted in a 58% increase in the number of samples needed, it was a tradeoff we were often willing to make since the chances of passing the study using a<=1 greatly increase.
The question now becomes: what happens as we increase the number of failures allowed (i.e. a<=2, a<=5, etc.)?
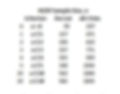
Taking 95% confidence and 97% reliability as an example and assuming the sample size & acceptance criterion are applied to each LOT, the number of samples and probability of passing all 3 lots are shown below.

The ideal sampling plan (white trace above) is one that would, using 95/97:
✅️ Pass 100% of processes with % defectives < 3%
❌ Reject (pass 0% of the time) processes with % defectives >= 3%
Allowing a greater number of failures with a bigger sample size means the plan behaves more like the ‘ideal’: increasingly passing very reliable processes and increasingly rejecting those with % defectives greater than the minimum reliability.
Unless the lot sizes used during regular production are very large, we seldom use anything greater than a<=1 in our studies; the number of samples required for inspection, and the cost / duration of the study simply become too great compared to the benefits - especially considering there are better alternatives.
More in a future post...